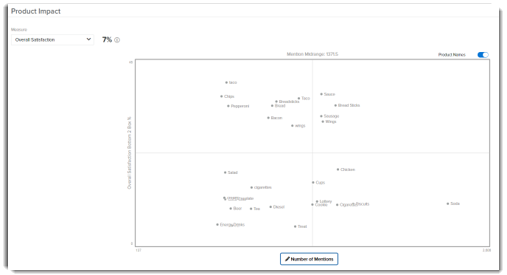
Use the Product Impact Report to quickly identify products that are having a negative impact on the overall experience – enabling fast and informed action.
Key Features
- Quickly identify products with the most mentions that are detracting from key measures.
- Which product is negatively impacting my overall satisfaction score?
- What product is being mentioned most often, or which product has the highest detractor score?
- Adjust the report date range to see how the impact changes over time
- Product X had the highest negative impact this month. How does that product impact different from a previous month or timeframe?
- Filter by visit type, time of day, or demographic metrics to better understand how products impact different experiences.
- Which product is negatively impacting the drive thru experience?
- Which product is mentioned most and impacts weekend guests?
|
 |
Accessing the Product Impact Report
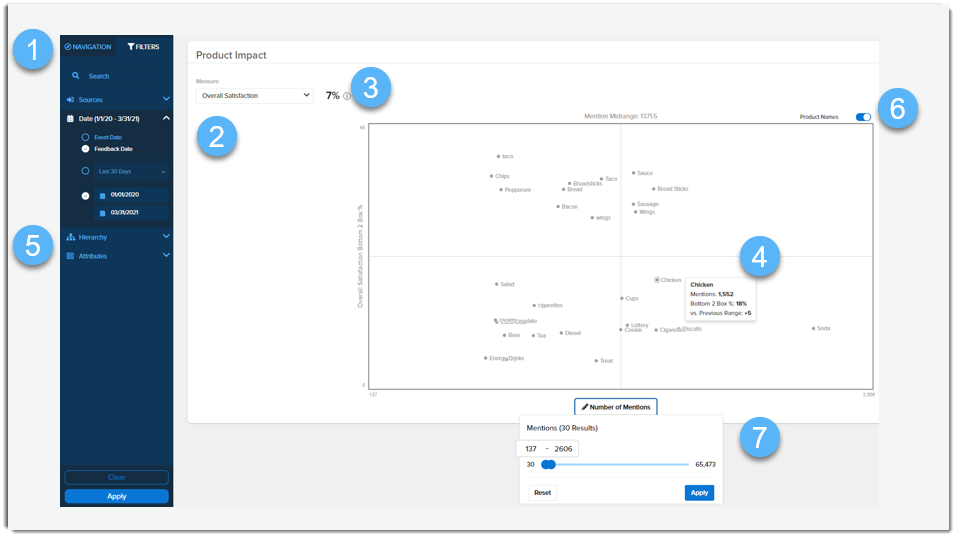
- Access the Product Impact report using the left navigation bar in smg360
- Select a measure for product mention comparison.
- The top box score for the measure you selected will be displayed to the right of the drop-down. This score is only based on feedback responses with a comment.
- Hover over a product on the chart to view the mention count, detractor score, and change from the previous period.
- Apply date, hierarchy, or attribute filters to the chart to view impact and product shift.
- Toggle on/off for product display names.
- Adjust the mention frequency and redraw product mentions on the impact chart.
|
 |
How Does Scoring Work?
- Only products with at least 30 mentions will be displayed on the chart
- Top Box score or Promoter score is based on the scale of the measure selected
- 5pt scale measures will show % of 5s
- 9pt scale measures will show % of 9s
- 10 pt scale measures will show % of 9 +10s
- 11pt scale measures will show % of 10 +11s
|
- Y-Axis scoring is based on the scale of the measure selected
- 5pt scale measures will use bottom 2 box % (1 +2s)
- 9pt scale measures will use detractor % (0-5s)
- 10 + 11pt scale measures will use detractor % (0-6s)
|
Report Limitations
Collecting specific item references through Text Analytics is currently a limitation. For example, "BBQ Chicken Pizza" would be represented by "BBQ," "Chicken," and "Pizza," all independently in the current text analytics setup since we use pre-defined libraries by industry.

Comments
Please sign in to leave a comment.